Do you want to add some growth to your portfolio? For ideas on how to start your search, we ran a screen.
We began by screening the tech sector for stocks rallying above their 20-day, 50-day, and 200-day moving averages, indicating these stocks have bullish upward momentum. Then to analyze the sources of their profitability, we ran DuPont analysis on the names.
DuPont analyzes return on equity (net income/equity) profitability by breaking ROE up into three components:
ROE
= (Net Profit/Equity)
= (Net profit/Sales)*(Sales/Assets)*(Assets/Equity)
= (Net Profit margin)*(Asset turnover)*(Leverage ratio)
It therefore focuses on companies with the following positive characteristics: Increasing ROE along with,
•Decreasing leverage, (i.e. decreasing Asset/Equity ratio)
•Improving asset use efficiency (i.e. increasing Sales/Assets ratio) and improving net profit margin (i.e. increasing Net Income/Sales ratio)
Companies with all of these characteristics are experiencing increasing profits due to operations and not to increased use of financial leverage. The companies listed below have all three positive attributes found from DuPont.
Interactive Chart: Press Play to compare changes in market cap over the last two years for the top six stocks mentioned below. Analyst ratings sourced from Zacks Investment Research.
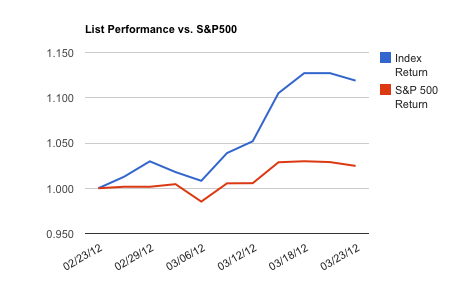
We also created a price-weighted index of the stocks mentioned below, and monitored the performance of the list relative to the S&P 500 index over the last month. To access a complete analysis of this list's recent performance, click here.

Do you think these companies will continue to see strong profitability in the future? Use this list as a starting point for your own analysis.
1. Apple Inc. (AAPL): Designs, manufactures, and markets personal computers, mobile communication and media devices, and portable digital music players, as well as sells related software, services, peripherals, networking solutions, and third-party digital content and applications worldwide. The stock is rallying 5.98% above its 20-day moving average, 18.17% above its 50-day MA, and 44.74% above its 200-day MA. MRQ net profit margin at 28.2% vs. 22.45% y/y. MRQ sales/assets at 0.334 vs. 0.308 y/y. MRQ assets/equity at 1.54 vs. 1.587 y/y.
2. Acuity Brands, Inc. (AYI): Engages in the design, production, and distribution of lighting fixtures, lighting controls, and related products and services in North America and internationally. The stock is rallying 2.05% above its 20-day moving average, 4.77% above its 50-day MA, and 25.52% above its 200-day MA. MRQ net profit margin at 6.3% vs. 5.74% y/y. MRQ sales/assets at 0.297 vs. 0.279 y/y. MRQ assets/equity at 2.084 vs. 2.105 y/y.
3. CA Technologies (CA): Designs, develops, markets, delivers, licenses, and supports information technology management software products that operate on a range of hardware platforms and operating systems. The stock is rallying 2.46% above its 20-day moving average, 7.12% above its 50-day MA, and 25.77% above its 200-day MA. MRQ net profit margin at 20.82% vs. 17.48% y/y. MRQ sales/assets at 0.107 vs. 0.096 y/y. MRQ assets/equity at 2.058 vs. 2.176 y/y.
4. InfoSpace Inc. (INSP): Develops search tools and technologies that assist consumers with finding content and information on the Internet. The stock is rallying 3.99% above its 20-day moving average, 6.00% above its 50-day MA, and 30.49% above its 200-day MA. MRQ net profit margin at 34.33% vs. 18.22% y/y. MRQ sales/assets at 0.169 vs. 0.141 y/y. MRQ assets/equity at 1.113 vs. 1.169 y/y.
5. Perficient Inc. (PRFT): Provides information technology consulting services primarily in the United States, Canada, and Europe. The stock is rallying 3.17% above its 20-day moving average, 5.95% above its 50-day MA, and 28.45% above its 200-day MA. MRQ net profit margin at 3.86% vs. 2.34% y/y. MRQ sales/assets at 0.315 vs. 0.269 y/y. MRQ assets/equity at 1.126 vs. 1.172 y/y.
6. Roper Industries Inc. (ROP): Designs, manufactures, and distributes medical and scientific imaging products and software, energy systems and controls, and industrial technology products and radio frequency products and services. The stock is rallying 4.74% above its 20-day moving average, 6.00% above its 50-day MA, and 21.22% above its 200-day MA. MRQ net profit margin at 16.46% vs. 15.79% y/y. MRQ sales/assets at 0.139 vs. 0.134 y/y. MRQ assets/equity at 1.665 vs. 1.843 y/y.
7. SS&C Technologies Holdings, Inc. (SSNC): Provides software products and software-enabled services to the financial service providers worldwide. The stock is rallying 9.74% above its 20-day moving average, 17.82% above its 50-day MA, and 32.91% above its 200-day MA. MRQ net profit margin at 13.86% vs. 10.66% y/y. MRQ sales/assets at 0.079 vs. 0.067 y/y. MRQ assets/equity at 1.232 vs. 1.488 y/y.
*Accounting data sourced from Google Finance, all other data sourced from Finviz.


No comments:
Post a Comment